Jul 17, 2026
North East charity expands training schemes after £10,000 grant boost
North East charity Three13 has secured a £10,000 grant from The Bernicia Foundation to expand hospitality and carpentry training for people facing barriers to employment.
 techpoint
Jul 17, 2026
Nigeria’s central bank to track every retail dollar
On Techpoint Digest, we discuss how complaints against Kenyan digital lenders are on the rise, how the CBN wants to track every retail dollar, and how Prosus is selling its final Delivery Hero stake.
 ivpressonline
Jul 17, 2026
IVC inaugurates state-of-the-art automotive tech complex
IMPERIAL – The brand new state-of-the-art Automotive Technology Facilities Complex at Imperial Valley College was inaugurated on Wednesday, July 15, during a soft opening and ribbon-cutting ceremony.
 techfundingnews
Jul 17, 2026
This French startup scooped €5.1M to challenge Meta in the race to create lighter AR glasses
ENGO, based in Grenoble, makes augmented reality glasses for runners and cyclists. The company has raised €5.1 million...
Jul 17, 2026
Thousands of solar panels installed at schools across Tees Valley
Ten schools across Tees Valley have installed solar panels through the Solar for Schools programme, reducing energy costs and carbon emissions.
Jul 17, 2026
Cybeats Announces Non-Brokered Private Placement
Toronto, Ontario--(Newsfile Corp. - July 17, 2026) - Cybeats Technologies Corp. (CSE: CYBT) (OTCQB: CYBCF) ("Cybeats" or the "Company"), a leading provider of software supply-chain security, announces a non-brokered private placement offering of up to 8,823,530 common shares of the Company at a price of C$0.17 per common share for aggregate proceeds of up to C$1,500,000 (the "Private Placement"). The Private Placement is expected to close in the next 30 days. Al
 vcyamerica
Jul 17, 2026
College Grads Hurt by H-1B Visas
U.S. Government Accountability Office, public domain, via Wikimedia Commons. We are in the middle of a high-tech boom that is minting billionaires at a remarkable pace, and yet 8% of ...
 thenationalnews
Jul 17, 2026
Why the Meta chief AI officer's 'moral imperative' push is so hollow
The social media giant's recent AI backlash from customers is worth noting
 metro
metro
Jul 17, 2026
From ghd to Huawei and Pandora – here’s everything a shopping expert is buying this weekend
Once again, I've (hopefully) found a little something for everyone.
 expresscouk
Jul 17, 2026
BBC's star salaries are outrageous – but this unseen largesse is even worse
OPINION - LEO MCKINSTRY: The picture becomes much, much more depressing when you dig into the Beeb's annual report
 naturalnews
Jul 17, 2026
Anthropic Alleges China-Linked Operators Used 28.8 Million Queries to Extract AI Knowledge
(NaturalNews) Anthropic told the Senate Banking Committee that operators affiliated with the Chinese conglomerate Alibaba ran approximately 28.8 million queries on ...
Jul 17, 2026
Wrexham’s £200m City of Culture dream gets major boost
A LEADING North Wales arts centre has backed Wrexham's bid for a potential £200m City of Culture windfall.
 gulfnews
Jul 17, 2026
Shark FlexStyle review: The smart alternative to the Dyson Airwrap for most buyers
Shark FlexStyle vs Dyson Airwrap: We compare attachments, styling performance, heat protection and value to help you choose the right multi-styler.
 naturalnews
Jul 17, 2026
AI Firms Fuel San Francisco’s Office Market Recovery, Driving Record Leasing Demand Nationwide
(NaturalNews) Artificial intelligence firms are leasing office space at a record pace across the United States, with demand surging 85% in the 12 months through May...
 naturalnews
Jul 17, 2026
Texas Police Spend $4.5 Million on Surveillance-Equipped SUVs, Bypassing Standard Procurement
(NaturalNews) The Texas Department of Public Safety (DPS) spent almost $4.5 million on four 2026 Chevrolet Tahoes equipped with the FalcoNet cell-site simulator sys...
 fool
fool
Jul 17, 2026
The S&P 500 Is Flashing an Ominous Warning That's Been Observed Only Once Before. Will History Repeat Itself?
The S&P 500 Shiller CAPE ratio is on the verge of reaching its highest level in history.
 citizen
Jul 17, 2026
South Africa’s arms industry needs to be nurtured
The current South African National Defence Force is a pathetic shadow of what it could be.
 moneyweek
Jul 17, 2026
How Taiwan's TSMC became the world's top chip company
When Morris Chang first had the idea for TSMC, no one took him seriously. Now the Taiwanese chip company is indispensable – but is it still worth buying?
 inews
inews
Jul 17, 2026
Andy Serkis: ‘I’ve never been able to escape Gollum’
As he directs a Lord of the Rings spin-off, the actor and filmmaker talks about why it’s not just another cash cow – and how his own family’s experience of tyranny fed into a new adaptation of Animal Farm
 lbc
lbc
Jul 17, 2026
Drug-rape victims vow to shut down depraved 'online industry'
Speaking about the first time she realised her fiancé was raping her, Amanda said: “It took me a minute to work out what was happening because I couldn't move or speak.
 daryo_uz
Jul 17, 2026
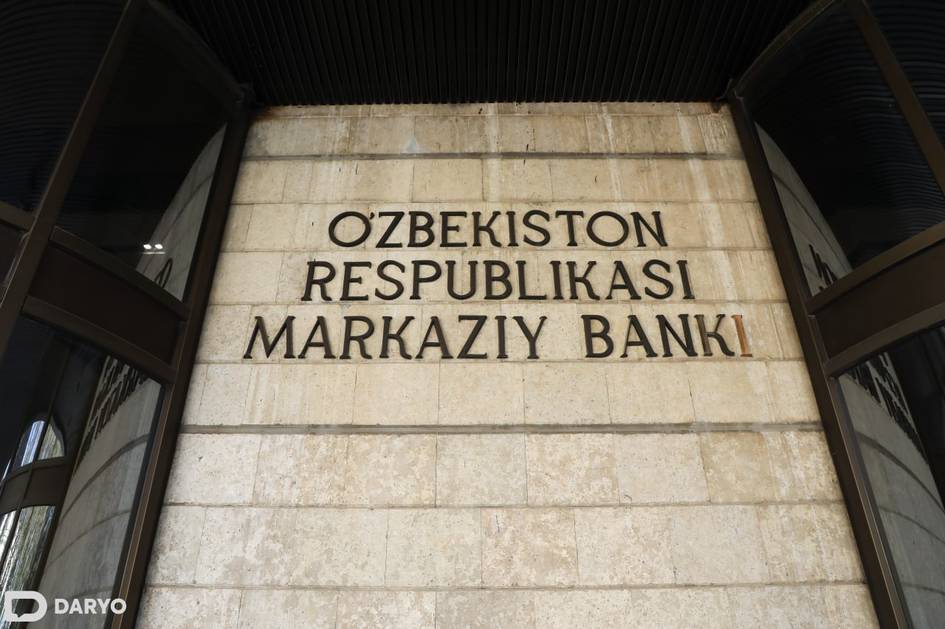
Uzbekistan establishes Islamic Finance Council to oversee sector development
Uzbekistan has established a five-member Islamic Finance Council under the Central Bank to develop Islamic finance standards, coordinate regulation, and oversee the expansion of Islamic banking services.
Jul 17, 2026
NSU opens new centre for cybersecurity research and workforce development
North South University (NSU) has inaugurated its Cybersecurity Center to advance research, develop skilled professionals and strengthen Bangladesh's resilience against emerging cyber threats. The North South University Cybersecurity Center was formally inaugurated at the university's Plaza Area on Thursday (16 July). The centre was established under the APAC Cybersecurity Fund of The Asia Foundation, in partnership with Protect.ngo and the Global Cyber Alliance, with support from Google.org. Rehan Asif Asad, Adviser to the Prime Minister for the Ministry of Posts, Telecommunications a
 cfotech_au
Jul 17, 2026
Technology debt is a balance sheet problem
Hidden legacy systems are draining budgets through maintenance, manual workarounds and cyber risk, turning deferral into an expensive future liability.
 semissourian
Jul 17, 2026
Out of the past: July 17
From interstate plans and Rush Limbaugh's $250 million radio deal to Mississippi floods, a missing judge and new bus routes, revisit Southeast Missouri news from past July 17s.
 irishtimes
Jul 17, 2026
Irish State bodies use password software licensed by Russian intelligence
Irish Times investigation finds software involved in handling of sensitive information with at least three agencies
 irishtimes
Jul 17, 2026
How Russian password technology made its way into Irish State agencies
Password manager Passwork purports to be EU-based but has extensive links to a Russian company licensed by Russia’s security service
 onlinemadison
Jul 17, 2026
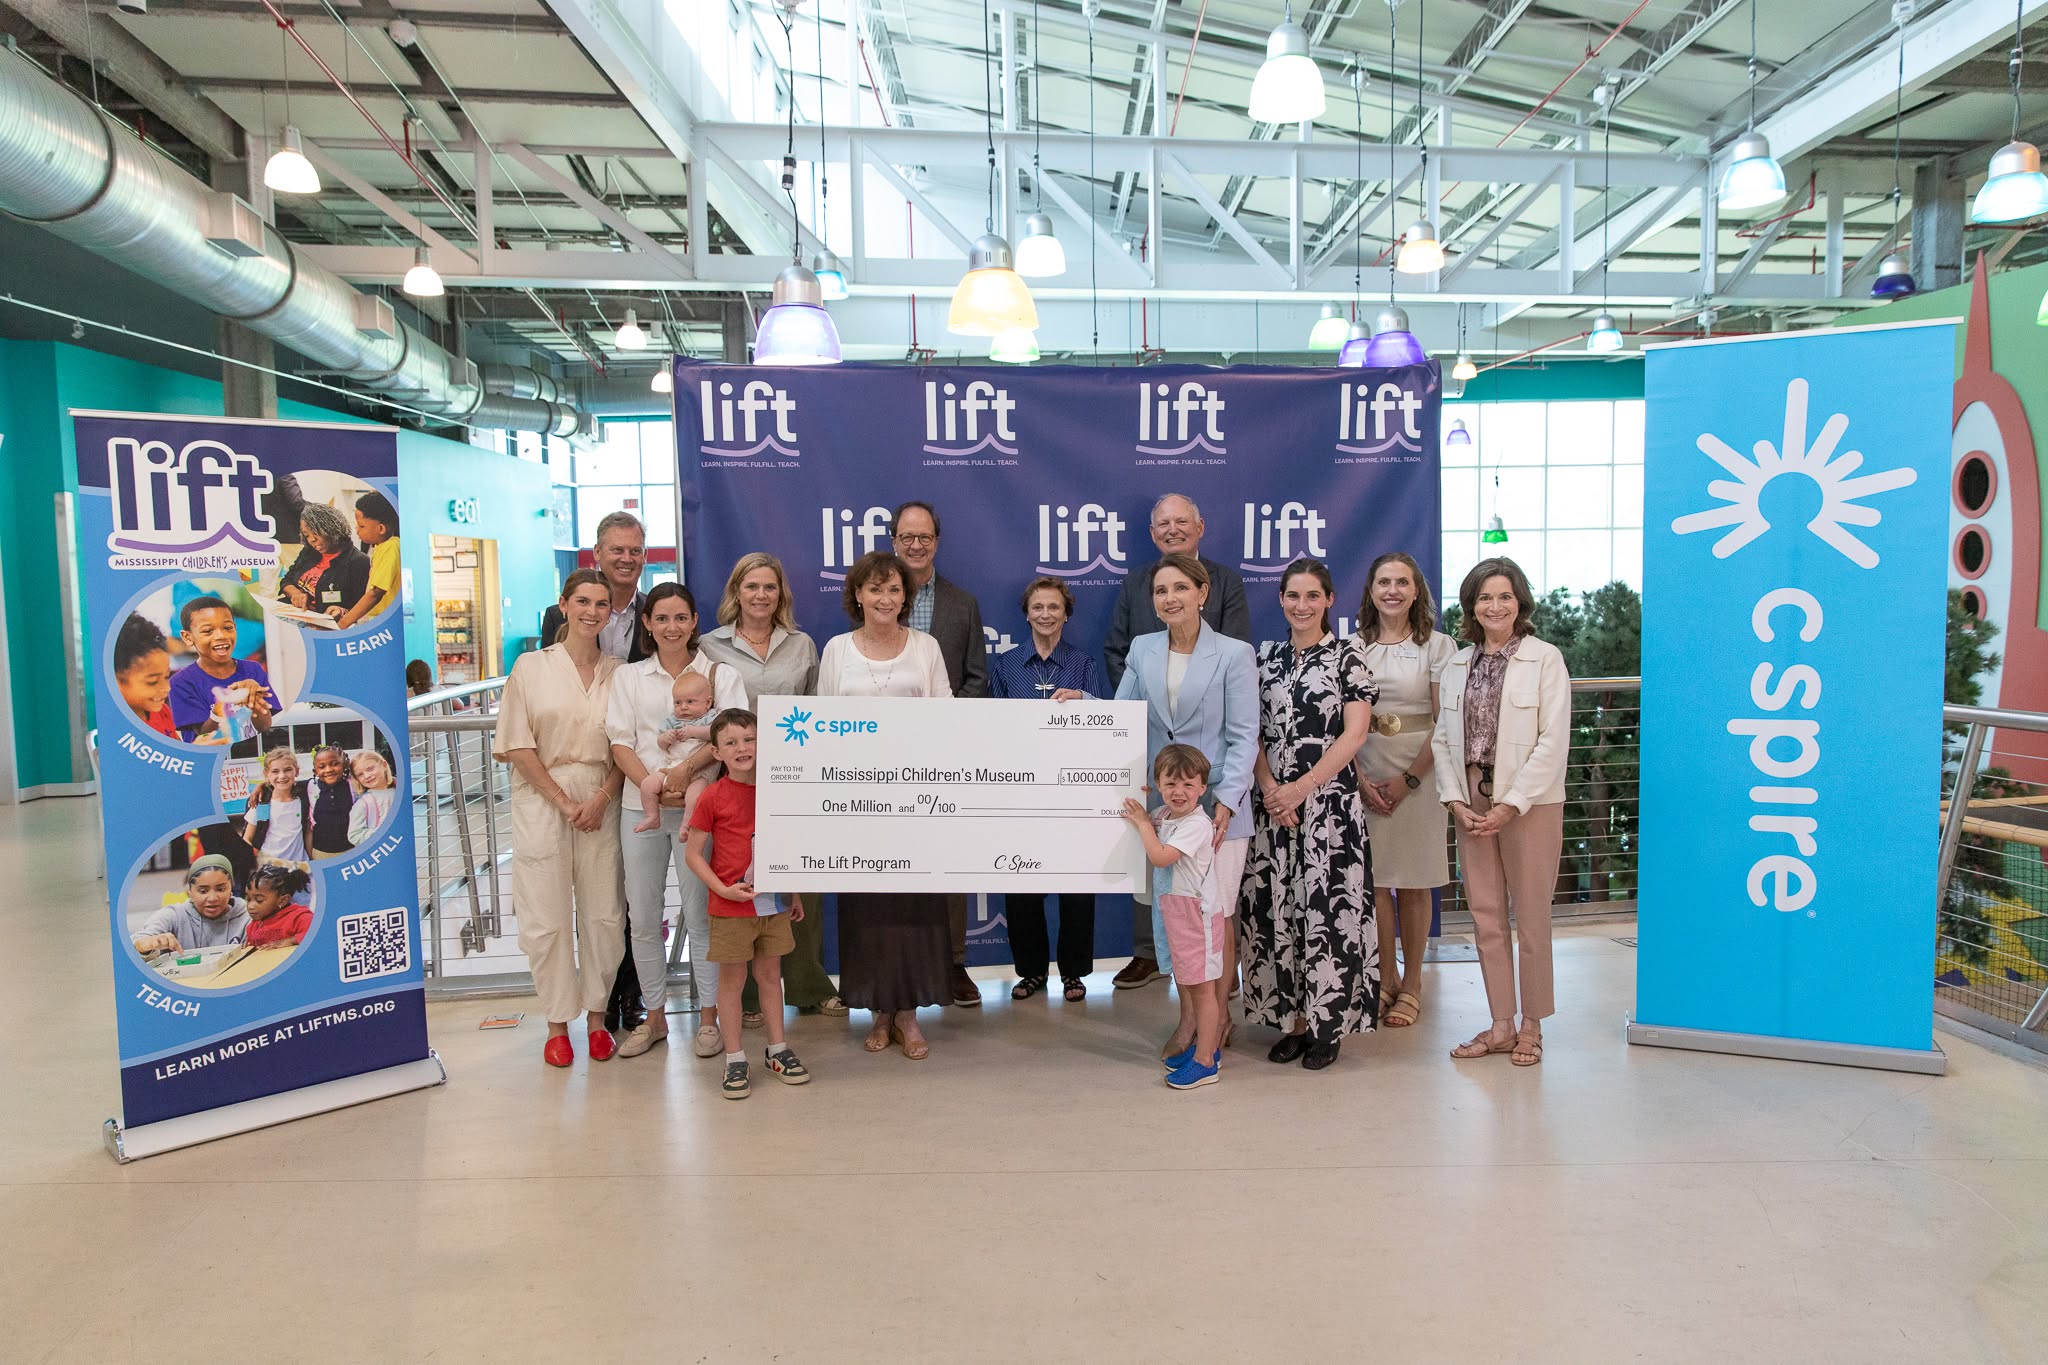
C Spire gives $1 million to Mississippi Children’s Museum for LIFT City STEM expansion
The Mississippi Children’s Museum (MCM) is thrilled to announce an incredible $1 million gift from C Spire to support the museum’s LIFT Capital Campaign,
 heraldscotland
Jul 17, 2026
Matt Forde on SNP scrutiny, Labour sexism and why Binface should fight Farage to win
Comedian Matt Forde accuses the SNP of an ‘allergy to scrutiny’, attacks Labour over sexism and urges Count Binface to win against Nigel Farage.
 today_az
 foreignaffairs
 timesofmalta
Jul 17, 2026
New PN MP and ex-police officer defends joining lawyer’s firm
Frank Tabone spoke about his appointment as Gozo shadow minister and his proposal to introduce a Gozo drugs squad
 mychesco
Jul 17, 2026
Teleflex Details ESG Progress in 2025 Global Impact Report
WAYNE, PA — Teleflex Inc. (NYSE: TFX) has released its 2025 Global Impact Report, detailing environmental, governance and social responsibility initiatives that investors and other stakeholders increasingly use to evaluate ...
 unionleader
Jul 17, 2026
John Stossel: Nuclear power
A few years ago, nuclear power looked doomed. Plants were shutting down.
Jul 17, 2026
Sergeant who led crackdown on illegal car meets cut by 43 per cent honoured
A police sergeant has been recognised for his efforts in tackling dangerous driving at illegal car meets across Hampshire.
 warringtonguardian_uk
Jul 17, 2026
International Warrington firm secures £20 million investment
A WARRINGTON firm has secured an £20 million investment.
 whathifi
Jul 17, 2026
How to watch Belgian Grand Prix 2026: live stream the F1 race from anywhere
How to watch Belgian Grand Prix 2026 live streams around the world. Free coverage, schedule, preview, 4K Ultra HD options for the F1 race weekend.
 dispatchlive
Jul 17, 2026
New Madiba statue to be unveiled as part of Mandela Day events
The Mandela family will unveil yet another statue of former president Nelson Mandela at his birthplace in Mvezo at the weekend.
 thestar_my
Jul 17, 2026
AI chatbots are at risk of spreading government restrictions on online speech, a new study says
Ask Claude to make a pamphlet critical of President Donald Trump or Britain's King Charles III, and Anthropic's chatbot would oblige. Prompted to do the same for Thailand's king, Saudi Arabia's crown prince or China's leader, and the artificial intelligence model declined.
 analyticsinsight
Jul 17, 2026
10 Microsoft Copilot Features in Power BI You Should Use
Explore Microsoft Copilot in Power BI with artificial intelligence. Learn how Copilot boosts reports, insights, and smarter decisions.
 finanznachrichten_de
Jul 17, 2026
GAC Celebrates 30-Millionth Vehicle Roll-off, Sharing Milestone Moment with Global Users
During the ceremony, GAC's overseas manufacturing bases were linked via live video. Its Thailand plant celebrated the roll-off of its 10,000th vehicle, a new model rolled off the line at the Indone...
 finanznachrichten_de
Jul 17, 2026
PrimeBOT Wins Gold and Silver at A' Design Award 2026 -- A New Language for Personal Robotics
What is a Personal Robot? PrimeBOT is the first brand to define this emerging category. Unlike industrial or service robots built for specific functions, the Personal Robot is shaped around the hum...
 stuff_co_nz
Jul 17, 2026
Air New Zealand to make history at new Sydney airport
It’s 100 days until Sydney’s newest airport, Western Sydney International Nancy-Bird Walton Airport (WSI), opens for passenger flights.
 sowetanlive
Jul 17, 2026
Calls for ‘clean air zones’ to tackle pollution by old cars
Researchers estimate emissions were linked to 500 premature deaths
 deadline
Jul 17, 2026
PVR Inox’s Sanjeev Kumar Bijli On India’s Box Office Recovery, Cinema Expansion & Cannes Acquisitions Haul
EXCLUSIVE: India’s theatrical market is one of the few in Asia that has outstripped pre-pandemic revenues, despite the growth of streaming, the slowdown in the Hollywood pipeline and all the other factors that have hampered box office in other international territories. In 2025, box office reached a record-breaking $1.48BN, due to a string of Hindi [...]
Jul 17, 2026
Mozilla accuses Microsoft of steering users to Edge
Users in India, the US and the UK still face browser choice barriers as Microsoft's Edge defaults remain hard to escape, Mozilla says.
 yankton_net
Jul 17, 2026
When The Forecasts Disagree
I once heard it said that a person with a clock always knows what time it is but a person with two clocks never knows what time it is. If the multiple sources don’t match up, you’re left with some...
 thestar_my
Jul 17, 2026
Google to allow third-party stores in its app store
Alphabet Inc's Google told a California federal court that it will begin allowing US users to download third-party app stores within its Google Play Store beginning the week of July 19.
 thestar_my
Jul 17, 2026
Why these Malaysian employees stay loyal to the same companies for years
As career moves become more common, there are those who find fulfillment building long-term careers in one organisation.
 news24
Jul 17, 2026
WATCH | Sdumo Mtshali gives ‘The Polygamist’ make-up team their flowers
Sdumo Mtshali is thanking the special effects makeup team behind his transformation as Jonasi Gomora in “The Polygamist” – the physical decline that helped him embody one of Mzansi’s most talked-about TV villains.
 yourstory
Jul 17, 2026
Andhra Pradesh’s founder-first growth strategy; Wipro’s net profit remains flat
Andhra Pradesh is pushing Mazzucato's entrepreneurial state further, treating entrepreneurship itself as public infrastructure across the state; Wipro delivered a muted performance for the first quarter of FY27 and the revenue guidance for the second quarter remained disappointing.
 news24
Jul 17, 2026
Trump revives ‘stolen election’ claims, accuses China of meddling
US President Donald Trump revived sweeping and unsupported claims of voter fraud and Chinese meddling – firing a clear warning shot ahead of midterm elections that many expect him to dispute.
 politico_eu
Jul 17, 2026
Google mega fine to slash taxpayers’ contributions to Brussels
After years of legal wrangling, Google earlier this month paid the €4.6 billion, which amounts to over 2 percent of the bloc’s total budget in 2026.
 economictimes_indiatimes
Jul 17, 2026
Netflix earnings forecast disappoints Wall Street, shares tumble
Netflix projected third-quarter revenue and earnings below Wall Street expectations. The company will now release viewing-hours reports annually instead of semi-annually. Netflix is focusing on advertising, live events, and video games for future growth. Its stock experienced a significant decline after the financial forecast was announced. Engagement metrics remain healthy, and the company is exploring new technological advancements.
Jul 17, 2026
‘Star Wars’ creator defends the use of AI in Hollywood: “It’s the future”
During an interview with A Rabbit’s Foot magazine, George Lucas, creator of Star Wars and one of the most influential figures in contemporary cinema, stated that artificial intelligence (AI) will become a relevant element within the film industry and considered that attempts to prevent its incorporation into the creative process will be difficult to sustain. [...] La entrada ‘Star Wars’ creator defends the use of AI in Hollywood: “It’s the future” se publicó primero en De Último Minuto English .
 biospace
 securitybrief_asia
Jul 17, 2026
Asia Pacific leads AI adoption but skills shortage bites
The region's corporate real estate teams are facing a widening skills gap as AI use outpaces readiness, JLL says.
 businesstimes
Jul 17, 2026
Don’t misinterpret Temasek as giving up on its net-zero ambition, say executives
Acknowledgement that it is unlikely to meet 2030 decarbonisation goals should be seen as a call to action
 stuff_co_nz
Jul 17, 2026
Is your technology investment showing up on the P&L?
Every technology invoice tells you what a business spends, but only the profit and loss statement reveals what those tools give back.
 hospitalitynews_in
 stockwatch
Jul 17, 2026
Artificial Intelligence Technology Solutions Secures $10M Equity Line
Artificial Intelligence Technology Solutions Inc. (AITX) has entered into an Equity Purchase Agreement with Trillium Partners LP, establishing an equity line of credit for up to $10,000,000 over a 36-month period. This agreement allows AITX to issue up to 1,555,000,000 shares, including 5,000,000 commitment shares, to Trillium at a discount to market prices. While providing crucial financing, the company faces significant dilution risk and its auditor has expressed substantial doubt about its ability to continue as a going concern, despite a 26% revenue increase to $7,745,336 and a net loss of $14.5 million for the fiscal year ended February 28, 2026.
 stlpr_org
Jul 17, 2026
At the World Cup, has 'VAR' gone too far? Some fans say it's ruining the tournament
In this World Cup, VAR, or video assistant referee, has become ubiquitous (and despised by many). But there was a time when fans and teams loved it. What went wrong?
 einpresswire
Jul 17, 2026
Pelnox Launches ONE-HAND MIXING®, a Two-Part Electrically Conductive Epoxy Adhesive for Consistent Bonding
No weighing, measuring, or manual mixing: ONE-HAND MIXING® delivers consistent conductive bonding for electronics, sensors, and large-area electrodes.
 pep_ph
 technologynetworks
Jul 17, 2026
Laser Test Helps Spot Deadly Methanol in Contaminated Alcohol Bottles
Discover how a Raman spectroscopy technique can help to identify bottles of alcoholic spirits that are contaminated with toxic methanol.
Jul 17, 2026
Solid State Battery Electrolyte Market Size, Share, 2034
The solid-state battery electrolyte market is projected to grow from $468.20 million in 2026 to $2,354.80 million by 2034, at a CAGR of 22.40% during the forecast period 2026–2034.
Jul 17, 2026
REF: FERNS26 GR01 - EDU-PHD | Courses | Queen's University Belfast
Apply for your research degree at Queen's University Belfast, Russell Group university. Find out more about funded and unfunded PhD projects.
 Crypto Briefing
Jul 16, 2026
Hyperliquid traders price CXMT shares 575% above IPO level ahead of Shanghai debut
CXMT's IPO highlights China's strategic push for tech independence, potentially reshaping global semiconductor dynamics amid geopolitical tensions. The post Hyperliquid traders price CXMT shares 575% above IPO level ahead of Shanghai debut appeared first on C…
 Crypto Briefing
Jul 16, 2026
Federal Reserve’s Logan says wages are not fueling inflation, points to energy prices instead
Logan's focus on energy prices over wages for inflation suggests potential rate hikes, impacting risk assets and crypto market dynamics. The post Federal Reserve’s Logan says wages are not fueling inflation, points to energy prices instead appeared first on C…
 Forbes
Jul 16, 2026
Neurons Playing Tetris: Intactis Bio Joins the Biocomputing Industry
Intactis Bio joins the Biocomputing industry, which seeks to deliver lower-energy, cost-efficient computing capacity driven by neuron-powered chips.
Jul 16, 2026
Toll Brothers Announces Grand Opening of Vista Ventana in La Mirada, California
New luxury condo community in LA County will open for sale July 18, with model home tours available New luxury condo community in LA County will open for sale July 18, with model home tours available
Jul 16, 2026
Toll Brothers Announces New Luxury Home Community Now Open in Yardley, Pennsylvania
Oakvale at Yardley offers luxury homes on expansive half-acre home sites in a prime Bucks County location Oakvale at Yardley offers luxury homes on expansive half-acre home sites in a prime Bucks County location
 WDIV ClickOnDetroit
Jul 16, 2026
Trump cites national security to stop offshore wind development. Here's what to know
President Donald Trump's administration has worked to stop offshore wind development on the grounds it’s a national security risk since late last year, halting work on major projects and buying back leases.
 Dealnews.com
Jul 16, 2026
"Data Makes the World Go 'Round: The Data, Tech, and Trust Behind AI Success" eBook : Free + digital download
Data Makes the World Go 'Round: The Data, Tech, and Trust Behind AI Success explores the role of data quality, technology, and trust in building successful AI initiatives. The eBook normally sells for $45, but TradePub is offering it as a free download throug…
 Ncspin.com
Jul 16, 2026
A double standard on press access
A healthy democracy depends on an informed public and that requires more reporting, more scrutiny, and more access to information.
 Dealnews.com
Jul 16, 2026
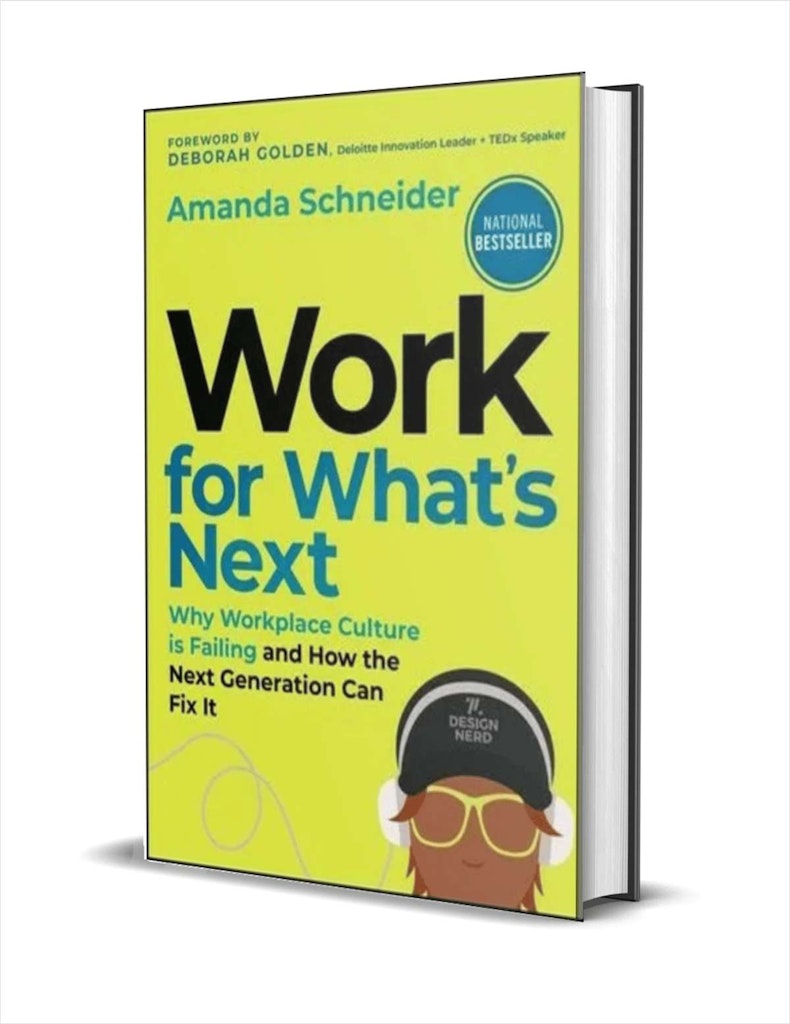
"Work for What's Next: Why Workplace Culture is Failing and How the Next Generation Can Fix It" eBook: Free + digital download
If you're looking for insights into the evolving workplace, Work for What's Next: Why Workplace Culture is Failing and How the Next Generation Can Fix It explores the challenges facing today's work environments and offers ideas for how the next generation can…
 Biztoc.com
Jul 16, 2026
Expands North Dakota AI Campus on Schedule
Applied Digital Corporation (NASDAQ:APLD) is one of the best low priced technology stocks to invest in. On July 2, Compass Point reiterated its Buy rating and $70 price target on Applied Digital Corporation (NASDAQ:APLD). The call was the firm's reaction to A…
 Biztoc.com
Jul 16, 2026
Benefits From Resilient Enterprise Computing Demand
Ingram Micro Holding Corporation (NYSE:INGM) is one of the best low priced technology stocks to invest in. On June 23, Morgan Stanley raised its price target on Ingram Micro Holding Corporation (NYSE:INGM) to $33 from $27.50, keeping its Equal Weight rating u…
 Biztoc.com
Jul 16, 2026
Rolls Out the Industry’s First AI Network Validation Tool
Viavi Solutions Inc. (NASDAQ:VIAV) is one of the best low priced technology stocks to invest in. On June 23, VIAVI Solutions Inc. (NASDAQ:VIAV) launched what it called the industry's first Ultra Ethernet Transport (UET) validation solution built for AI data c…
 The Times of India
Jul 16, 2026
Micron signs deals with Qualcomm, others for AI-powered automobile chip components
The agreements come as the industry races to expand manufacturing capacity to meet the booming demand for memory chips due to the rapid adoption of AI tools.
 Financial Post
Jul 16, 2026
Nasdaq 100 Slides as TSMC Results Revives AI Spending Concerns
US stocks declined on Thursday as Taiwan Semiconductor Manufacturing Co.’s results failed to boost artificial-intelligence stocks and traders assessed a worsening situation in the Middle East.
 Psychology Today
Jul 16, 2026
Why We Defend the People Who Con Us
The best con artists don't just fool you. They get you to defend them. Why smart, skeptical people end up protecting their own deceivers, and how to tell if you're one.
 Alliancenews.pk
Jul 16, 2026
OPGF Europe GCCI meeting
OPGF Europe Vice President Suleman Gondal visited the Gujranwala Chamber of Commerce and Industry (GCCI) to discuss diaspora investment, international trade, export promotion and stronger economic cooperation between overseas Pakistanis and local businesses.
 NBC News
Jul 16, 2026
Deal of the Day: Medicube’s new skin care device is already over 25% off on Amazon
Medicube’s Booster Pro X2 is 26% off. The new device is an upgrade to the Booster Pro and has seven modes that work for all skin types.
 The Verge
Jul 16, 2026
New York governor says she’s using AI to analyze ‘every single rule’ in the state
New York Governor Kathy Hochul might have just signed a moratorium on new AI data centers in the state, but she's not against using the technology herself. During an interview with Bloomberg's Odd Lots podcast, Hochul said that her team is using "AI to analyz…
 Fortune
Jul 16, 2026
Big Tech’s top executives warn enterprises are giving away too much to AI labs
Microsoft's Satya Nadella and Palantir's Alex Karp are both warning enterprises that AI labs are quietly mining the data that makes them valuable.
Jul 16, 2026
Trump administration hands out unlawful air pollution exemptions to more petrochemical facilities
The Trump administration has exempted more petrochemical facilities across the country from Clean Air Act standards
 CNET
CNET
Jul 16, 2026
At $400 Off, This Airseekers Robot Lawn Mower Bundle Really Makes the Cut
Not only can you get the Airseekers Tron SE robot lawn mower at a hefty discount, you'll also get $200 worth of accessories with this summer bundle.
 Next Big Future
Jul 16, 2026
SpaceX Leader in Installed World’s AI Chips – New AI Deals Soon
Aerial photos and other analysis of SPACEXAI colossus 2 indicate that there are 440,000 B200 and B300 chips active as of 2 weeks ago.
 New York Post
Jul 16, 2026
Meta creates monitoring tool for kids using its chatbot to discuss self-harm — and alerts their parents
Meta is launching a new AI safety feature that alerts parents via Instagram supervision tools if teens discuss self-harm or suicide with Meta AI. Learn how it works.
 Theepochtimes.com
Jul 16, 2026
TSMC to Invest Additional $100 Billion in Arizona After Strong Q2 Profits
TSMC to Invest Additional $100 Billion in Arizona After Strong Q2 Profitstheepochtimes.com
 The Next Web
Jul 16, 2026
AI and a brain implant restored a paralysed man’s movement and touch
Researchers have restored hand movement and the sense of touch to a man paralysed from the chest down. The results, published in Nature Medicine, suggest the technology partly rewired his nervous system. The system, called a “double neural bypass,” comes from…
 WWD
WWD
Jul 16, 2026
The Secret to Sweat-Proof Makeup This Summer? One of These Portable Handheld Fans
Portable fans are having a fashion moment: proving to be extremely handy for keeping makeup on in stifling heat.
 Macworld
Jul 16, 2026
All of a sudden, Apple is winning AI
Macworld Has Apple focused too much on AI over the past few years, or not enough? It depends on who you ask. On the one hand, the topic is faddish, inescapable, and faintly apocalyptic, and I get thoroughly depressed listening to AI buzzwords at Apple…
 pymnts.com
Jul 16, 2026
Credit Cards Start Picking Up the AI Tab
Credit card rewards have always tracked what consumers value most. Airline miles arrived when business travel was the aspiration. Cash back followed when simplicity beat complexity. Now, artificial intelligence subscriptions are becoming a monthly fixed cost …
 C-sharpcorner.com
Jul 16, 2026
Cloud-Native Architecture: Principles, Benefits, and Best Practices
Unlock scalability, agility & reliability with cloud-native architecture. Learn principles, benefits, and best practices for modern apps.
 Next Big Future
Jul 16, 2026
SpaceX AI Satellites Will Have 250 Kilowatts of Power
SpaceX will increase the peak power per Starmind AI satellite up to 250 Kilowatt with some added batteries. GPU average power consumption if it’s doing inference over the course of 24 hours is ~2/3 of its peak power, even if you’re super efficient. SpaceX AI …
 Tom's Hardware UK
Jul 16, 2026
Linus Torvalds rebukes anti-AI stances in the Linux kernel code review process, says 'Linux is not one of those anti-AI projects' — creator embraces AI as just a tool and 'clearly a useful one'
Linus Torvalds, Linux's creator and kernel manager, has seemingly taken an accepting stance of AI-assisted tooling.
 The Times of India
Jul 16, 2026
The Internet or TikTok didn't invent cat videos, Thomas Edison beat it by 130 years
Viral cat videos history: Thomas Edison's film studio filmed cats over a century ago. His studio produced short films featuring simple spectacles for audiences. These early films were designed for quick entertainment and visual appeal. Edison's Kinetograph ca…
 New York Post
Jul 16, 2026
Chip giant TSMC to pour ‘largest’ $100B more into US amid AI-fueled earnings boost
Taiwan Semiconductor Manufacturing Co. is supercharging an already massive U.S. investment spree – pledging an additional $100 billion to meet surging AI demand. TSMC Chairman and Chief Executive C.C. Wei delivered the news Thursday after posting second-qua…
 Dailymail.com
Jul 16, 2026
Your SUV could be at risk as Japanese automaker recalls hundreds of thousands of vehicles
Yet another automaker has issued an urgent recall after a potentially fatal mistake on several of its best-selling models.
 PRNewswire
Jul 16, 2026
B&H Launches Virtual Production Category and Educational Hub
Pro Video News: B&H Photo Video has officially unveiled our Virtual Production and XR category, serving an array of industries including cinema, broadcast, and education. NEW YORK, July 16, 2026 /PRNewswire/ -- B&H is thrilled to share that a new category, Vi…
Jul 16, 2026
FreightWaves Announces 2026 AI Excellence in Supply Chain Awards Winners
FreightWaves reveals 2026 AI Excellence in Supply Chain Awards winners. 15 companies honored across two categories following record nominations. The post Fre...
 Crypto Briefing
Jul 16, 2026
Hyperliquid sets $5 reference price for CXMT pre-IPO contract, but traders are already pricing it much higher
The inflated trading prices highlight speculative fervor and potential volatility in pre-IPO markets, impacting investor strategies and valuations. The post Hyperliquid sets $5 reference price for CXMT pre-IPO contract, but traders are already pricing it much…
 Crypto Briefing
Jul 16, 2026
EY-Parthenon warns US decoupling from China could cost $14T
US-China decoupling could reshape global supply chains, elevate operational costs, and drive innovation in digital currencies and infrastructure. The post EY-Parthenon warns US decoupling from China could cost $14T appeared first on Crypto Briefing.
 The New Republic
Jul 16, 2026
Trump’s Teleprompter Operator Made $100K Betting on His Speeches
A White House teleprompter operator appears to have made over $100,000 betting on President Trump’s speeches.ABC News, citing unnamed sources, reports that a longtime staffer for the president, Gabriel Perez, was placing bets on Trump’s speeches on the predic…
 Tom's Hardware UK
Jul 16, 2026
Neural atom quantum computing roadmap — how laser-cooled trapped atoms could pave the path beyond physical qubit counts
Neural Atom Quantum Computing is a rapidly accelerating part of the Quantum puzzle. Featuring software-defined configurable arrays, qubits can be physically moved mid-computation, and this roadmap highlights three leading companies, QuEra, Atom Computing, and…
Jul 16, 2026
National Organization on Disability Launches EnAble Learning to Boost Workforce Performance through On-Demand Disability Inclusion Training
Program offers essential learning and development curriculum to employers across the country Program offers essential learning and development curriculum to employers across the country
 Financial Post
Jul 16, 2026
Society for Medical Decision Making Honors UMIT TIROL and Harvard Professor Uwe Siebert with 2026 Career Achievement Award
OSLO, Norway, July 16, 2026 (GLOBE NEWSWIRE) — The Society for Medical Decision Making (SMDM) presented its highest career honor, the 2026 Career Achievement Award, to Professor Uwe Siebert, MPH, MSc, ScD, of UMIT TIROL and Harvard University, recognizing his…
 Yahoo Entertainment
Jul 16, 2026
Big Tech earnings will put focus on AI spending
Big Tech's earnings are coming fast, and it'll be all about AI spending.
Jul 16, 2026
Express Wash Concepts Strengthens Detroit Market Leadership with Bloomfield Hills Clean Express Grand Opening
Customers can enjoy free signature ceramic washes July 17-26, 2026 at 40 E. Square Lake Blvd. in Bloomfield Hills, Michigan COLUMBUS, Ohio and DETROIT, July 16, 2026 /PRNewswire/ -- Express Wash Concepts (EWC), one of the nation's fastest-growing express car …
 Crypto Briefing
Jul 16, 2026
US slaps 25% tariffs on Brazil, turning up the heat just before elections
The tariffs could strain US-Brazil relations, prompting Brazil to diversify trade partners, potentially reshaping global trade dynamics. The post US slaps 25% tariffs on Brazil, turning up the heat just before elections appeared first on Crypto Briefing.
 Bellingcat.com
Jul 16, 2026
Identifying the Crypto Entrepreneur Linked to Popular Forum Trading in ‘Leaked’ Nudes of Women
This investigation is a collaboration between Bellingcat and New Zealand news site The Press. You can read The Press’ piece here. Content warning: This article discusses non-consensual sexually explicit content and child sexual abuse material. In 2024, a for…
Jul 16, 2026
CNCF Strengthens Partnership with Broadcom as a Platinum Member to Advance AI-Ready Cloud Native Infrastructure
Collaboration with CNCF reflects Broadcom's continued investment in open source innovation, cloud native resilience and the technologies powering the next generation of AI workloads Key Highlights Broadcom has elevated its membership to Platinum, deepening it…
 PRNewswire
Jul 16, 2026
Illumina expands Billion Cell Atlas program with new AI drug developers
Partners will use unprecedented data scale to advance more precise medicines to approval SAN DIEGO, July 16, 2026 /PRNewswire/ -- Illumina, Inc. (NASDAQ: ILMN) today announced that the Billion Cell Atlas alliance has added three new member companies, includin…
 Blog.google
Jul 16, 2026
Reimagining higher education with the Waterloo Futures Lab
Google and the University of Waterloo’s Futures Lab is helping students build real-world AI tools and prepare for jobs of tomorrow.
Jul 16, 2026
Horizon Trade Launches Agentic Platform to Completely Redefine Professional Equity and Crypto Investing
Founded by a 19-year-old entrepreneur, Horizon Trade is set to transform the way everyday and professional traders do research and execution using AI, enabling them to turn a trading idea into a backtested, automated strategy and execution. Horizon's AI-nativ…
Jul 16, 2026
Race Communications Kicks Off Multimillion-Dollar Investment in City of Lodi
Race Communications makes way in Lodi, with construction underway. ...
 Activistpost.com
Jul 16, 2026
Anthropic is launching its own drug discovery programs for rare diseases using Claude superintelligence
The news landed like a thunderclap in a San Francisco conference room on June 30, 2026. Anthropic, the artificial intelligence company behind the cutting-edge Claude model, announced it will launch its own preclinical drug-discovery programs targeting neglect…
Jul 16, 2026
NINJIO Acquires SafeStack to Expand Human Risk Management Platform with Secure Code Training
Acquisition integrates SafeStack's developer security training into the NINJIO platform LOS ANGELES, July 16, 2026 /PRNewswire/ -- NINJIO, a leader in cybersecurity awareness and human risk management, today announced its acquisition of SafeStack, a purpose-b…
Jul 16, 2026
[Security Blog] Modern Software’s Hidden Cost: Managing Risk in the Open-Source Ecosystem
Modern software development has shifted towards prioritising speed. Developers no longer write code from scratch; instead, they assemble applications from a vast ecosystem of open-source building blocks. However, this efficiency comes with a hidden cost:
Jul 16, 2026
Metropolis Appoints Eric Garcetti, Hugh Wyman Howard III, and Jason Park as Advisors
Business, civic, and national security leaders join as Metropolis scales its AI-powered infrastructure for the Recognition Economy LOS ANGELES, July 16, 2026 /PRNewswire/ -- Metropolis Technologies, Inc. ("Metropolis"), the leader in applied AI for the real w…
 PRNewswire
Jul 16, 2026
AI Gives People Back Their Own Voice: Chen Institute and Science Prize Honors Neuroscientist Sergey Stavisky
A UC Davis brain-computer interface decodes neural signals into speech in real time — restoring the ability to speak, and even sing, in a person's own voice. REDWOOD CITY, Calif., July 16, 2026 /PRNewswire/ -- The Tianqiao and Chrissy Chen Institute, in partn…
 PRNewswire
Jul 16, 2026
Apollo Neuroscience Announces Publication of Landmark Clinical Study Demonstrating Apollo Wearable Use Yields an Average of 46 More Minutes of Sleep Per Night
Clinical study of 475,000 nights of sleep data across 935 people over 3 years found Apollo use was associated with an average of 46 additional minutes of sleep per night and a 77% reduction in odds of sleeping less than 6 hours in one night of use. SAN FRANCI…
Jul 16, 2026
Splashtop Wins 2026 Visionary Spotlight Award for Unified Platform for Autonomous Endpoint Management
ChannelVision Magazine recognizes Splashtop's modern approach to helping MSPs simplify operations, strengthen security, and grow more efficiently. ChannelVision Magazine recognizes Splashtop's modern approach to helping MSPs simplify operations, strengthen se…
 Nathanbarry.com
Jul 16, 2026
I Asked a Speaking Coach to Roast My Biggest Speech | 137
I recently sat down with my speaking coach, Mike Pacchione, for this totally unprecedented episode where we dissect, minute by minute, my full keynote speech from this year’s Craft + Commerce conference. We’re not holding anything back. Mike points out my fla…
 Antaranews.com
Jul 16, 2026
Indonesia, China launch joint shipbuilding technology academy
Indonesia and China have strengthened vocational education in the maritime sector by establishing the Sino-Indonesian Shipbuilding Technology Academy (SISTA), ...
 Insurance Journal
Jul 16, 2026
Palm Beach Rejects Data Center Near Mar-a-Lago After Backlash
Palm Beach County commissioners rejected a proposal late Wednesday to build a digital infrastructure hub to house AI data centers and warehouses, voting in line with the ardent opposition from local residents. The facility, known as Project Tango, would have …
Jul 16, 2026
SWEETFULL 5000mAh Portable Handheld Turbo Fan w/ 5 Speeds & Digital Display $9.90
SWEETFULL Technology via Amazon [amazon.com] has *SWEETFULL 5000mAh Portable Handheld Turbo Fan w/ 180° Adjustable Design, 5 Speeds & Digital Display* (Black or Pink) on sale for $14.99 - $5.10 off...
 The Next Web
Jul 16, 2026
The UK won’t restrict VPNs after all, and its own research is why
The UK looked set to crack down on VPNs as it tightens the rules for children online. Instead it has backed off, and its own research is the reason why. Online Safety Minister Kanishka Narayan put it plainly on the BBC. “We decided not to limit VPNs,” he said…
 Southernsavers.com
Jul 16, 2026
Publix Unadvertised Deals: 7/15-7/21
Here's a list of the Publix unadvertised deals I found at my store this week! Get good deals on fully cooked chicken, President butter, and more. Closeout Deals Pilgrim's Cheesy Jalapeno Loaded Nuggets, $5.99 Big Tree Farms Tamarind Teriyaki, $3.84 La Choy So…
 The Times of India
Jul 16, 2026
Industry body FAITH advocates for a tourism growth charter to unlock opportunities at annual conclave
India's tourism sector will grow at 8.5% this year, contributing $286 billion to GDP. By 2036, India is projected to become the world's fourth largest tourism economy. Industry leaders advocate for a tourism growth charter with immediate, measurable prioritie…
 Techpowerup.com
Jul 16, 2026
(PR) Bosgame Demonstrates Scalable Private AI with 7-Node AI MAX+ 395 Cluster
Bosgame, a technology-based electronic product brand, has demonstrated distributed inference of the DeepSeek-V3.1 671B-parameter model on its AI MAX+ 395 7-Node Cluster. Built from seven Bosgame M5 AI Mini PCs connected through USB4 Direct Connection, the sys…
 BusinessLine
Jul 16, 2026
Myntra expands AI across shopping, seller operations to speed up product launches
The company is also expanding AI-led shopping experiences through conversational commerce, contextual styling and virtual outfit recommendations.
 The Globe And Mail
Jul 16, 2026
UnitedHealth earnings gain momentum as turnaround efforts pay off, shares surge
Company saw improvements in its health insurance and Optum health services units; raised forecast after topping second-quarter profit estimates
 Crypto Briefing
Jul 16, 2026
Saronic Technologies to open Texas shipyard for autonomous vessels
The new shipyard could enhance U.S. maritime dominance and alter geopolitical dynamics, impacting regional stability and security strategies. The post Saronic Technologies to open Texas shipyard for autonomous vessels appeared first on Crypto Briefing.
 Electrek
Jul 16, 2026
XPeng L03 ships Google Maps Auto SDK — a first for an APAC automaker
XPeng used the global launch of its new L03 in Munich to announce that the electric SUV coupe is the first vehicle from any Asia-Pacific automaker to ship with Google Maps’ Auto SDK built in. The integration replaces XPeng’s overseas navigation stack with Goo…
 9to5Mac
Jul 16, 2026
Rumor: Apple increases orders for key component ahead of foldable iPhone launch
Apple has reportedly ramped up orders for vapor chambers, signaling that the cooling technology could play a bigger role across its future hardware lineup. Here are the details.
 pymnts.com
Jul 16, 2026
US, UK Seek Common Path for Stablecoins, Tokenization in Transatlantic Markets
The U.S. Treasury Department and HM Treasury have unveiled a joint blueprint for closer regulatory cooperation on digital assets. It features a series of measures designed to align the two countries’ approaches to stablecoins, tokenization and digital financi…
 TechRadar
Jul 16, 2026
Cloud sprawl taught organizations a lesson. AI is testing whether they learned it
Businesses are layering AI complexity onto already sprawling cloud environments.
Jul 16, 2026
‘Bitcoin Beats AI as an Inflation Hedge’ — Binance Founder Changpeng Zhao Warns
Binance founder Changpeng Zhao, aka “CZ,” has praised AI technology and its far-reaching effects on society.
 Biztoc.com
Jul 16, 2026
MoonPay Acquires Crypto Deposit Firm Glide
Financial technology company MoonPay has acquired Glide, a startup firm that lets customers accept cryptocurrency deposits from any token, wallet, exchange, or card. The takeover's value hasn't been made public but the transaction has been reported as an all-…
 Geeksaresexy.net
Jul 16, 2026
What does it mean to be ‘quantum’? A physicist explains the basics behind Einstein’s spooky actions at a distance
In quantum entanglement, you can learn something about one particle by observing the other in its pair, even across vast distances. koto_feja/E+ via Getty Images Aldo Romero, West Virginia University Imagine shining a flashlight across a dark room. You can pr…
 Ibtimes.com.au
Jul 16, 2026
Wall Street's Fear Gauge VIX Jumps 3.66% to 16.24 as Chip Stock Selloff Reignites Investor Anxiety Again
The CBOE Volatility Index rose 3.66% amid semiconductor selloffs and Middle East tensions, reflecting ongoing market volatility influenced by geopolitical risks and technology sector fluctuations.
 The Verge
Jul 16, 2026
‘No company is going to go to jail for you’: Proton’s CTO on balancing privacy, policy, and trust
Today on Decoder, we’ve got the first of a two-part series on the systems that run the world: I’m talking with Bart Butler, the CTO of Proton, the company that makes private and secure productivity software. You probably know it best for Proton Mail, which is…
Jul 16, 2026
A New Perspective on Munch’s Famous Frieze, How NYC’s Antiquities Trafficking Unit Transformed the Art Market: Morning Links for July 16, 2026
A fresh take on Edvard Munch’s Famous Frieze, how NYC's Antiquities Trafficking Unit transformed the art market, and more.
 Electrek
Jul 16, 2026
CATL’s 30-year sodium-ion battery takes over grid storage
CATL has signed a memorandum of understanding with Dutch energy company Alfen to deploy 5 GWh of its Tener Sodium energy storage systems across Europe, one of the largest sodium-ion commitments the region has seen. The batteries are rated for 15,000 cycles an…
 CNA
CNA
Jul 16, 2026
Trump Media to license Truth Social data to financial services firms
July 16 : Trump Media & Technology Group on Thursday launched Truth API, a licensed data feed that will provide financial services companies with "the fastest" access to posts from the highest-ranking Truth Social accounts.The paid-for API (application progra…
CNA
Jul 16, 2026
Trump Media unveils data feed for businesses tracking Truth Social posts
July 16 : Trump Media & Technology Group on Thursday launched "Truth API", a data feed that will provide businesses with real-time access to posts from the highest-ranking Truth Social accounts.The API (application programming interface) is aimed at giving or…
 Malwarebytes.com
Jul 16, 2026
The backlash against Flock cameras is spreading
Privacy concerns have dogged Flock's automated license plate recognition system for years. Now accuracy and reliability are coming under scrutiny too.
 TwinCities.com-Pioneer Press
Jul 16, 2026
Obituary: Former Ax-Man owner David Gray was inventor, sculptor, philanthropist
Obituary: Former Ax-Man owner David Gray was inventor, sculptor, philanthropisttwincities.com
 Ibtimes.com.au
Jul 16, 2026
Russell 2000 Slips 0.18% to 2,970 as the Small-Cap Rally Pauses Following Its Best First Half Since 1991
The Russell 2000 index has surged nearly 22% in 2026, marking its best first-half performance since 1991, driven by semiconductor gains and improved small-cap fundamentals.
 TechRadar
Jul 16, 2026
Russians need a VPN to access Google and Apple as unexplained nationwide outages hit
Russian internet users awoke to broken connections across Google, Apple, and GitHub websites. While state censors deny involvement, the outages highlight why VPNs are more crucial than ever.
 Bitcoinfoundation.org
Jul 16, 2026
Future Crypto Bull Market Leaders: Top Coins That Could Dominate the Next Cycle
The top coins that dominate the next bull market will not necessarily be the same ones that delivered the best returns during the previous cycle.... The post Future Crypto Bull Market Leaders: Top Coins That Could Dominate the Next Cycle appeared first on Bit…
 Thurrott.com
Jul 16, 2026
Windows Weekly 992: Gassy Jack
Leo, Richard, and Paul discuss another record-breaking Patch Tuesday, Windows Insiders, AI, Xbox and gaming, and more. The post Windows Weekly 992: Gassy Jack appeared first on Thurrott.com.
 Yahoo Entertainment
Jul 16, 2026
The 10 best matches of an unforgettable World Cup, ranked
This summer's World Cup has produced so many brilliant performances and so much compelling late-match drama that choosing a game of the tournament is harder than ever.
 Newsonjapan.com
Jul 16, 2026
Japan’s Content Industry Booms
Japan’s content market has reached a record high as companies increasingly transform popular characters and stories into immersive experiences that allow fans to step inside the worlds of their favorite works. (News On Japan)
 Financial Post
Jul 16, 2026
Global software giant chooses Saskatoon as a battleground in the AI race
As a German chip software developer aims to claim a bigger slice of the $1-trillion semiconductor industry, the company is expanding its reach into Canada in an unlikely research and development hub — Saskatoon. Siemens Canada Ltd., a German subsidiary, devel…
 The Next Web
Jul 16, 2026
Oracle leads the race to build Japan a secret, air-gapped cloud
Oracle is leading the race to build Japan an air-gapped cloud, sealed off from the internet. Washington wants it to counter Chinese hacking. Before the US shares more of its secrets with Japan, it wants Japan to lock them down. Oracle is now the front-runner …
 Biztoc.com
Jul 16, 2026
‘Japan’s excellence is a philosophy, a way of life’: Jensen Huang wants robots to take care of an aging society with a labor shortage
Japanese communications company Fujitsu is leading a major push in artificial intelligence using Nvidia’s technology, bringing together what it said was the best in Japan’s manufacturing prowess in robotics with AI. The technology area known as “physical AI” …
 Biztoc.com
Jul 16, 2026
Statement on Regulation E-Delivery
Statement on Regulation E-Delivery Today, the Commission took an important step toward allowing the financial services industry to harness technology for the benefit of everyday American investors. By proposing to permit electronic delivery (e-delivery) to be…
 Biztoc.com
Jul 16, 2026
The time for Clarity is here: Congress has a chance to pass the most important technology law since the Telecoms Act
Spending more than two decades in Congress, I saw firsthand how legislative momentum can propel our country forward — and how legislative inertia can leave us scrambling to catch up. Today, Congress stands at a crossroads: the United States can remain the wor…
Jul 16, 2026
Five Reputable Automotive Wire Harness Connector Manufacturers in China 2026: Advancing Electrical Connection Solutions
Five Reputable Automotive Wire Harness Connector Manufacturers in China 2026: Advancing Electrical Connection Solutionsapnews.com
 Fortune
Jul 16, 2026
Trump insists ‘Iran is unhappy right now’ while venting about ‘electric catapults that don’t work’ at defense tech summit
After a long aside about the use of magnets to improve catapults on vessels, Trump finally offered, “I hope I'm not boring anybody.”
 Globalresearch.ca
Jul 16, 2026
Video: Ten Humanist Principles. An Interview with Dr. Rodrigue Tremblay
Below is a 2016 interview with Dr Rodrigue Tremblay, author of The Code for Global Ethics: Ten Humanist Principles. To read this article in the following languages, click the Translate Website button below the author’s name. Hebrew, Русский, Turkce, Portug…
 Dailymail.com
Jul 16, 2026
Crypto gang who impersonated police to steal £4million before splurging on luxury holidays, cars and Rolexes are jailed
Anthony Ikenwe, 29, Kevin Nwamma, 25, and Hamza Bashir, 23, posed as police officers to steal more than £4million and fund a playboy lifestyle of designer cars, Rolexes and exotic holidays.
Jul 16, 2026
ONAR Holding Corporation Issues Letter to Stockholders Outlining a Pivotal Year Ahead
CEO Claude Zdanow details improving operating results, the commercialization of the Company’s Cortex technology, a signed non-binding letter of intent for a potentially transformative acquisition, a signed term sheet for a proposed $15 million financing, and …
Jul 16, 2026
The Real Reason Why Tech Elites Are Finally Investing in Sports
Seahawks Acquired for $9.6B, Yankees x Apollo $3B Deal, New 'F1 for Horse Racing' League
 The Conversation Africa
Jul 16, 2026
Who owns an AI generated song? What we can learn from the phonograph and the evolution of copyright laws
History suggests copyright adapts to technology. AI may be no exception.
Jul 16, 2026
Artelo Biosciences Announces Results from a Nonclinical Osteoarthritis Study Supporting ART26.12 as a Potential First-in-Class New Therapy for Chronic Pain Conditions
Osteoarthritic Pain Model Results Further Validate FABP5 as a Novel Therapeutic Target in Pain Management Osteoarthritic Pain Model Results Further Validate FABP5 as a Novel Therapeutic Target in Pain Management
 The Conversation Africa
Jul 16, 2026
Young people are among the most at risk of stalking – but many don’t recognise it
Research reveals young people aged 16 to 24 don’t always recognise what stalking is, particularly when it involves someone they might know.
 Ieee.org
Jul 16, 2026
Digital Surveillance Reshapes Fishery Enforcement in Indonesia
In the eastern Indian Ocean, south of Java in the vast sea stretching toward Australia, a fishing vessel slightly alters its course while operating near the boundary of its authorized fishing ground. Nothing appears unusual on deck. Nets remain in the water. …
Jul 16, 2026
Harvey has made its third acquisition in 7 months — and it signals where it's going next
Harvey's acquisition of Benchmark, a startup for asset managers, marks its push beyond Big Law into the broader corporate market.
Jul 16, 2026
Dyadic Expands Bio industrial Pipeline with New Proprietary Industrial Enzyme Program
Dyadic Expands Bio industrial Pipeline with New Proprietary Industrial Enzyme Program...
Jul 16, 2026
Enphase Energy Highlights Safety and Reliability of the IQ EV Charger 2 Across Europe
FREMONT, Calif., July 16, 2026 (GLOBE NEWSWIRE) -- Enphase Energy, Inc. (NASDAQ: ENPH), a global energy technology company, today highlighted the safety and reliability of its IQ® EV Charger 2, now available across European markets. As home charging becomes i…
Jul 16, 2026
New Review Examines Anatomical and Methodological Differences Between Auricular and Cervical Vagus Nerve Stimulation
ROCKAWAY, N.J., July 16, 2026 (GLOBE NEWSWIRE) -- electroCore, Inc. (Nasdaq: ECOR), a commercial-stage bioelectronic medicine and wellness company and leader in non-invasive vagus nerve stimulation technologies, today announced the publication of the peer-rev…
Jul 16, 2026
Former Smith+Nephew Global Orthopaedics President Craig Gaffin Joins MedEdge Holdings as Partner
Healthcare industry veteran brings more than 25 years of commercial leadership experience to help expand MedEdge's platform for acquiring, building and commercializing innovative surgical technology companies Healthcare industry veteran brings more than 25 ye…
 PRNewswire
Jul 16, 2026
West Tennessee Healthcare expands critical care support through eICU Program in partnership with Philips and hellocare.ai
JACKSON, Tenn., July 16, 2026 /PRNewswire/ -- West Tennessee Healthcare is continuing to strengthen critical care services across the region through the expansion of its systemwide eICU program powered by Philips eCareManager and integrated with the hellocare…
Jul 16, 2026
Cognex Announces Second Quarter 2026 Earnings Release and Conference Call Dates
NATICK, Mass., July 16, 2026 /PRNewswire/ -- Cognex Corporation (NASDAQ: CGNX), the global technology leader in industrial machine vision, will release earnings for the second quarter of 2026 on Wednesday, August 5, 2026, after market close. The Company will …
Jul 16, 2026
Beacon Security Raises $13 Million in Seed Funding to Give AI Agents a Trustworthy Data Foundation for Cyber Defense
Backed by Notable Capital, leading cybersecurity funds and a coalition of top CISOs and founders, Beacon achieves 300% ARR growth in H1 2026 as enterprises across financial services, insurance, and technology replace legacy security architectures with the age…
 PRNewswire
Jul 16, 2026
Lenovo Launches Legion R9000P Featuring World's First Inkjet-printed OLED Display from TCL CSOT
Breakthrough integration marks a major industry milestone, bringing TCL CSOT's next-generation Inkjet-printed OLED technology to the laptop market for the first time. SHENZHEN, China, July 16, 2026 /PRNewswire/ -- Lenovo, a global technology powerhouse, has o…
Jul 16, 2026
CAEVES Sets New Strategic Direction, Bringing Decades of Enterprise Data to Life, Named CIOReview's Top AI-Ready Deep Storage Solution 2026
NEW YORK, July 16, 2026 /PRNewswire/ -- CAEVES Technology, Inc., today announced a new strategic direction for its CAEVES Intelligent Deep Storage™ platform, repositioning the company around a single strategic focus: bringing decades of enterprise data back t…
Jul 16, 2026
26 Meta employees sue, claiming AI flagged workers on medical and pregnancy leave for layoffs
Current and former employees have filed a lawsuit claiming AI penalized protected leave. Here's what employees should know about their rights.
Jul 16, 2026
Mykhailo Fedorov highlights 22 key achievements of the Ministry of Defence of Ukraine during his tenure
Mykhailo Fedorov outlined the Ministry of Defence's key achievements during his tenure as Minister of Defence.
Jul 16, 2026
President Xi Jinping Meets with President of Kazakhstan Kassym-Jomart Tokayev
On the afternoon of July 16, 2026, President Xi Jinping met with the President of Kazakhstan Kassym-Jomart Tokayev, who is in China for the 2026 World AI Conference and High-Level Meeting on Global AI Governance, at the Xijiao State Guest Hotel in Shanghai.
Jul 16, 2026
'What A Nightmare': Zelenskyy's Dismissal Of Defense Minister Sparks Fury In Ukraine
Ukrainians reacted with fury to the abrupt ouster of Mykhaylo Fedorov, the tech-minded defense minister whose embrace of drone warfare innovation for many signaled a break from old-school military thinking and shady business interests.
 BusinessLine
Jul 16, 2026
All clear for Skyroot Aerospace’s maiden test flight of Vikram-1 on July 18
Skyroot Aerospace's Vikram-1 test flight on July 18 marks India's private sector entry into the global launch market.
 PRNewswire
Jul 16, 2026
Garmin unveils G2000 PRIME Integrated Flight Deck
G2000 PRIME brings turbine-class avionics technology to high-performance piston and electric aircraft OLATHE, Kan., July 16, 2026 /PRNewswire/ -- Garmin (NYSE: GRMN) today introduced G2000® PRIME, its new premium integrated flight deck for high-performance Cl…
 The-independent.com
Jul 16, 2026
OpenAI launches $230 keyboard amid Apple theft allegations
Codex Micro comes ahead of mystery device that CEO Sam Altman says is ‘the coolest piece of technology that the world will have ever seen’
 Provideocoalition.com
Jul 16, 2026
Sony Future Filmmaker Awards 2027 adds Immersive category
For the 2027 edition, the Sony Future Filmmaker Awards introduces the Immersive category, welcoming short films with immersive formats including 3D, 180°, and 360° video. Now in their fifth year, the Sony Future Filmmaker Awards spotlight and celebrate the f…
 CBC News
Jul 16, 2026
Smoke-filled skies, poor air quality warning remain across GTA
A thick, smokey haze continues to envelop the Greater Toronto Area as an orange-level air quality warning is still in place Thursday from Environment Canada.
 9to5Toys
Jul 16, 2026
Woot’s Countdown to Birthday sale is taking up to $1,000 off Samsung Odyssey/M-series monitors today with deals from just $290
Woot has just launched a new Countdown to Birthday! sale, dropping a wide selection of Samsung gaming monitors to some of their best prices yet. The prices for these discounted models start at $289.99 Prime shipped, and you can save up to a whopping $1,000 on…
 Crypto Briefing
Jul 16, 2026
Hanwha Life Esports advances to EWC26 playoffs, and crypto prediction markets are paying attention
HLE's playoff success highlights the growing synergy between esports and crypto markets, signaling potential shifts in digital finance trends. The post Hanwha Life Esports advances to EWC26 playoffs, and crypto prediction markets are paying attention appeared…
 BusinessLine
Jul 16, 2026
Aurum PropTech acquires Housing.com in all-equity deal to build AI-powered real estate platform
Aurum will issue 1,97,93,309 equity shares, representing approximately 20.5 per cent of its enlarged share capital, to acquire 100 per cent of Housing.com
 Cyberinsider.com
Jul 16, 2026
EFF: Apple the only major wearable vendor offering E2EE for health data
EFF says Apple is the only wearable manufacturer among ten brands that offers end-to-end encryption for users' cloud-synced health data.
 Antaranews.com
Jul 16, 2026
Indonesia readies strategic steps to bridge gap in AI capability
The Indonesian Ministry of Communication and Digital Affairs is mapping out strategic measures to bridge the Artificial Intelligence (AI) capability gap amid ...
 National Post
Jul 16, 2026
Captain Canada: How William Shatner became our most daring and enduring star
An award-winning horseman, accomplished pilot, motorcycle enthusiast and real-life space traveller, the 95-year-old is still in high demand
 Al Jazeera English
Jul 16, 2026
Hundreds protest in Kyiv over Zelenskyy’s dismissal of defence minister
Mykhailo Fedorov has been credited with reforming defence procurement and tackling corruption.